Posted: June 28, 2021
To simplify the design of industrial solar heat systems in Europe, the German University of Kassel has developed an Excel tool that can be used to create standardised heat load profiles in multiple industrial subsectors. The amount of heat that industrial businesses use each day is a very important factor in sizing solar systems and estimating annual solar fractions. The free tool, created as part of IEA SHC research platform Task 64 Solar Process Heat, can be downloaded from the Task 64 website.
To calculate the efficiency of a solar heat system and its possible contribution to energy production, designers need to know the required temperature levels and the seasonal changes in heat demand at the site where the system is to be installed. A new Excel tool developed by researchers working for the University of Kassel can now help those designers avoid costly, time-consuming on-site measurements by offering them a free tool to create standardised annual, generic heat load curves in industry.
“We’ve analysed the daily natural gas consumption of about 800 German grid-connected customers that each use at least 1.5 GWh annually. Nearly half of them are industrial businesses. The other half are service sector companies or owners of residential buildings. We found that even in industry, the quantity of heat a customer requires often depends on the ambient temperature,” said University of Kassel’s Felix Pag, who also leads the Integrated Energy Systems group, a subtask of Task 64.
In addition to ambient temperature, it is the intensity of manufacturing activities that has a significant influence on factory heat demand. To control for this, the researchers looked for differences in gas consumption on weekdays and weekends including public holidays. One variable they did not include in their calculations, however, was the fluctuation in demand throughout the day, as heat storage makes it easy to provide energy in the evening hours.
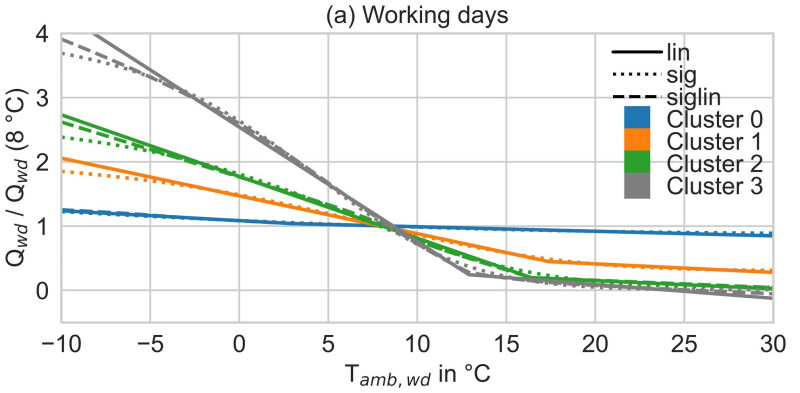
A machine learning algorithm was then used to group the heat load profiles by their dependence on ambient temperature. With four workday clusters (see chart below), the analysis offers a good compromise between accuracy and a manageable small number of clusters, Pag said.
Clustered gas consumption profiles for large German heat consumers on weekdays. All values were standardised relative to an ambient temperature of 8 °C, a method also used by gas companies. Besides four weekday clusters, the Excel tool includes five representing weekends or public holidays.
Source: University of Kassel
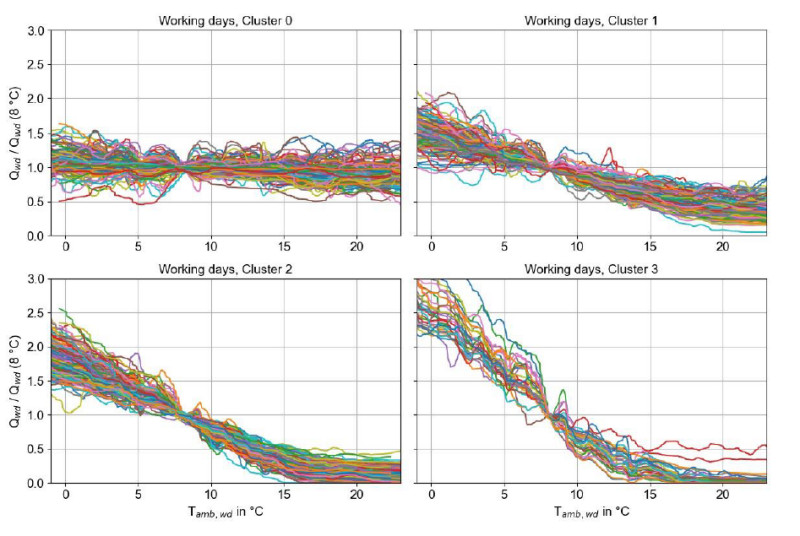
While Cluster 0 in the chart above shows that some customers need about the same quantity of heat on each workday throughout the year, the rest of the images depict the growing influence that ambient temperatures have on system output in clusters 1 to 3. Hence, solar thermal is best suited for factories with heat loads that resemble cluster 0, as this means there is fairly high demand for thermal energy even in summer. Cluster 2 and 3 require more heat in winter, which allows for only small solar fractions if seasonal storage is not part of system design.
After choosing one of the four weekday or five weekend clusters, users of the new tool simply need to enter the estimated yearly heat demand in MWh and the daily mean air temperatures at the proposed site to generate a column that reveals the average on-site heat demand per day. More information on how to use the tool can be found in the Task 64 report available for download below.
“Our next objective is to design integrated energy systems that use solar and heat pump technology to increase the share of renewable energy in clusters 1 to 3,” he said. Task 64 will run for a total of four years, until the end of December 2023.
Organisations mentioned in this article: